

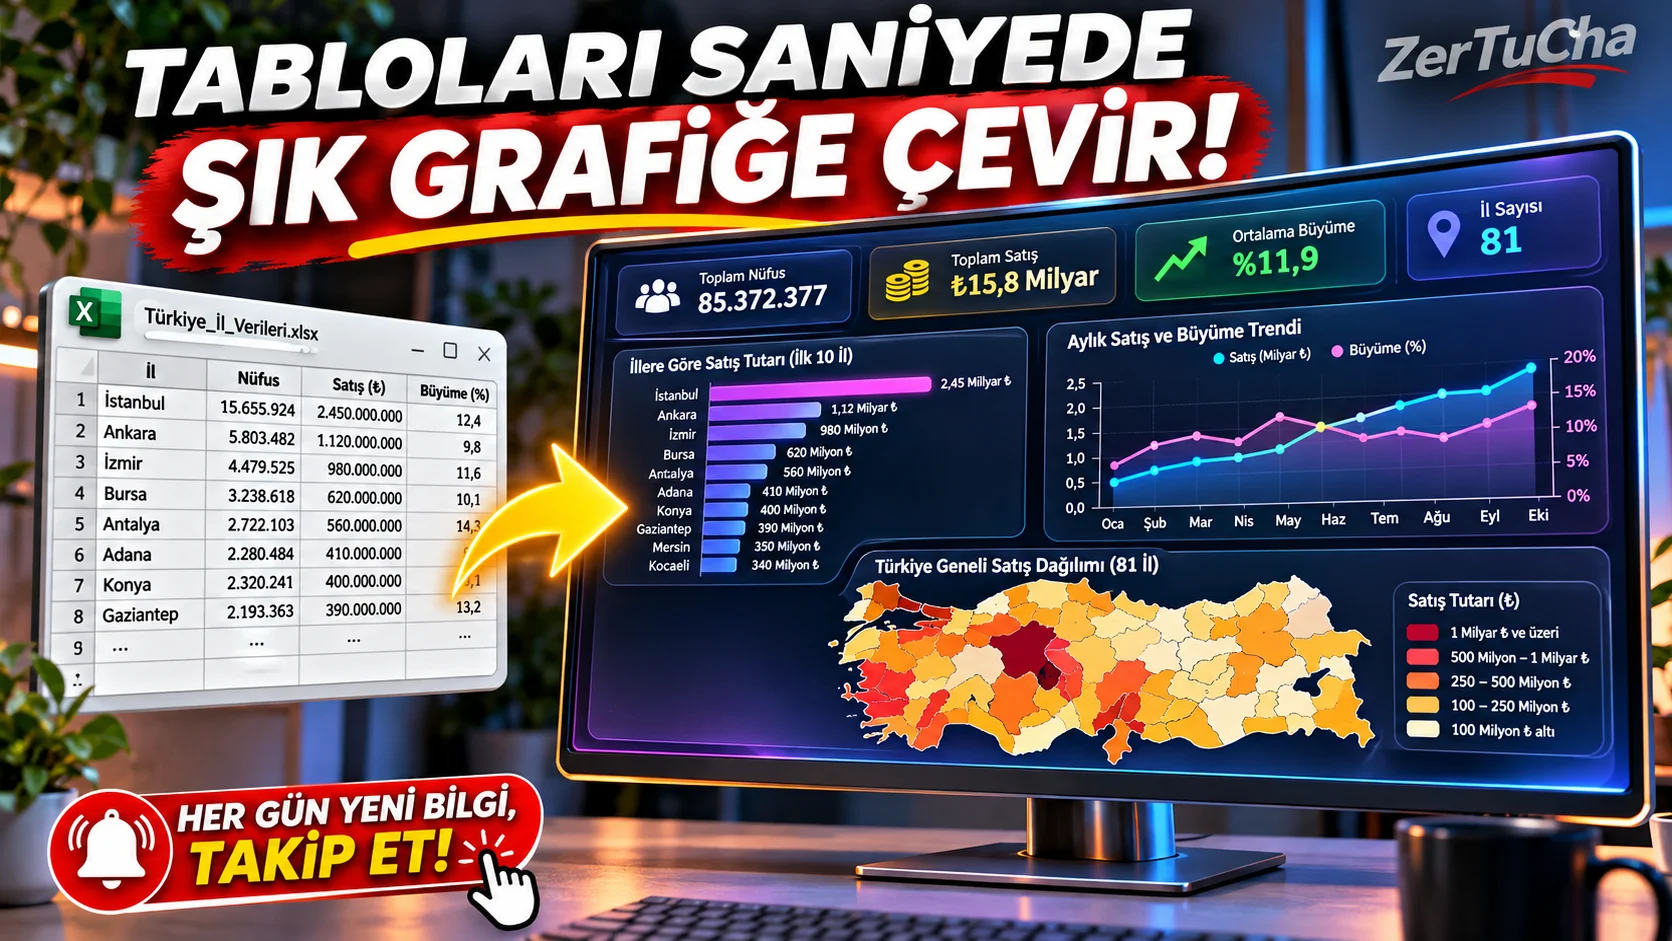
Turn Messy Excel Tables into Interactive Charts and Maps in Seconds: Datawrapper!
SITE NAME AND LINKS:
-
Site Name: Datawrapper
-
Official URL: https://www.datawrapper.de/
-
Origin / Service Language: Germany (Datawrapper GmbH - Berlin) / English interface (All titles, number formats and Turkey city/district maps within the graphic are 100% Turkish supported)
-
Pricing and Privacy Page: https://www.datawrapper.de/pricing and https://www.datawrapper.de/privacy
-
Yesterday Our World in Data; well your own figures (for example, the price increases in a news article you prepared, the growth data of your own YouTube channel, the results of a survey or your own data list for 81 provinces of Türkiye) Like the New York Times, BBC or major news portals a professional, interactive graphic or painted map of Türkiye? Excel's standard charts look like they're from the 1990s, and drawing individual bars in design programs takes hours. Here's what the world's biggest newsrooms and researchers use Datawrapper (
datawrapper.de), boring digits in 4 easy steps turns it into stunning graphics and maps!The best part is, without any registration or credit card on the home page "Start creating" button! On the site 20+ chart types (Bar, Line, Pie, Scatter, Arrow Charts), stylish mobile-friendly comparison charts and Ready election/data maps covering 81 provinces of Türkiye is at your disposal completely free of charge!
-
STEP BY STEP USE:
-
From your browser https://www.datawrapper.de/ and "Start creating" button (The editor opens directly without registration).
-
Choose what you want to create: New Chart, New Map (Map > Choropleth Map > "Turkey" and select the 81 province map) or New Table (Interactive Table).
-
Step 1 (Upload Data): Copy and paste your data from Excel or Google Sheets directly into the box (
Ctrl + V) and "Proceed" button. -
Step 3 (Visualize): Type the chart type, color palette (with colorblindness friendly control!), your English chart title, footer description, and source information; Test how it looks on each screen by pressing the phone/tablet/computer icons at the bottom.
-
Step 4 (Publish & Embed): High resolution for using your graphic in your presentations or videos PNG or Embed code and embed it in your own WordPress/news site as a live graphic showing numbers on mouse-over!
-
-
REQUIREMENTS AND LIMITS: Number of charts, maps and tables you can create in the Free plan unlimited; Exporting to PNG and live embedding on websites is completely free (When using live embed it is free for up to 10,000 views per month and has a small "Created with Datawrapper" is included).
-
PRIVACY AND SECURITY: Strict European Union as it is based in Germany (Berlin) GDPR is subject to data protection laws. "Publish" button, the data you paste will not be made available to the outside world; However, since the data of the charts you publish and embed on your website will be visible to readers, you should only use statistical and research data that you want to share.
-
ADVANTAGES, DISADVANTAGES AND WHOM IT IS SUITABLE FOR:
-
Advantages: Instant start without membership, unlimited free graph and table production, hosting Türkiye's 81 province maps as a ready-made template, live embedding in WordPress/blog sites and downloadable as clean PNG.
-
Disadvantages: Vector SVG/PDF print output and custom company font installation features are included in the Custom plan (PNG and live web graphics are completely free).
-
Who is it suitable for: News sites and local media publishers, bloggers, YouTube information/economics/history channels, students preparing thesis, and professionals presenting business reports.
-
-
BRIEF CONCLUSION: Whether you're covering numbers on a WordPress news site or a YouTube video; Instead of putting an Excel screenshot, you can paste the data into
datawrapper.deand produce a world-class graphic or map of Türkiye in 1 minute!




Henüz yorum yapılmamış. İlk yorumu siz yapın!
Bir Yorum Bırakın